GreatSchools Ratings in Georgia

Many families choose a school by choosing a house. Economists call this residential sorting, often summed up as families voting with their feet: households move to the communities whose public services fit what they want and can afford (Tiebout, 1956). Schools are a large part of that choice for parents, and families pay measurably more for homes inside the attendance zones of schools they see as better (Black, 1999).
Many families now decide which schools are better by looking at GreatSchools. Its 1–10 rating appears next to the price on major home listing sites, and the site had more than 43 million visits in 2018 (Barnum & LaMarr LeMee, 2019). A parent can see the number for a school long before visiting it, talking to other parents, or reading the state’s report card.
Earlier Work on GreatSchools
Researchers and journalists have asked what the rating captures. Private websites now do much of the public rating of US schools (Valant, 2017), and a Chalkbeat analysis found that GreatSchools ratings steer families toward whiter and more affluent schools (Barnum & LaMarr LeMee, 2019). Two studies tested the ratings directly. In the first, researchers used the staged rollout of GreatSchools ratings across the country between 2006 and 2015 and found that once ratings appeared, home values, incomes, and racial composition across communities pulled further apart (Hasan & Kumar, 2024). In the second, researchers compared GreatSchools components with lottery-based estimates of school quality in Denver and New York City middle schools and found that the test score component reflected who enrolls in a school more than what the school adds (Angrist et al., 2024).
The earlier studies covered a few cities, single components of the rating, or what the ratings do to neighborhoods. I wanted to see the summary rating, the number a parent sees, next to the state’s own scores for every school in one state.
The Dataset
In spring 2026, I used Claude Code to write a set of Python scrapers that collected GreatSchools ratings for Georgia’s public schools, starting from the federal list of 2,293 schools. I filled most of the gaps with retry passes and manual checks. I then joined four layers of data by school and ZIP code: the federal school records (with each school’s locale and its share of students on free or reduced-price lunch), the GreatSchools ratings, Georgia’s 2024 CCRPI scores, and the Zillow home value index. The final dataset holds 2,020 schools with both a GreatSchools rating and a CCRPI score, so I could read each rating against the school’s performance and its neighborhood at once.
First Results
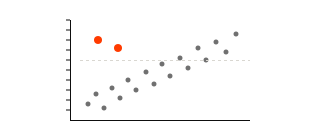
I ran the analysis in R, with scripts I wrote using Claude Code. The results show that GreatSchools ratings and CCRPI scores only partly agree. The ratings follow the state’s test score measure moderately and its growth and achievement gap measures weakly, so a school rated high by GreatSchools can sit below the state median on its CCRPI scores, and a school rated low can sit above it. The full results are in a paper I am preparing for submission.
A Dashboard for Families
I built the dashboard in R Shiny with Claude Code and published it so that parents, teachers, and school leaders can check a school for themselves. You search for a school by name or ZIP code and see its GreatSchools rating beside its CCRPI scores, its student poverty rate, and local home values. You can also narrow the list by grade level and by locale (city, suburb, town, or rural).
Interactive dashboard · R Shiny
Georgia School Ratings
Look up any Georgia public school by name or ZIP code and see its GreatSchools rating next to its CCRPI scores, student poverty rate, and local home values.
I would like to hear from parents and educators in Georgia who look up their school, especially if the comparison surprised them.
References
Angrist, J. D., Hull, P., Pathak, P. A., & Walters, C. R. (2024). Race and the mismeasure of school quality. American Economic Review: Insights, 6(1), 20–37. https://doi.org/10.1257/aeri.20220292
Barnum, M., & LaMarr LeMee, G. (2019, December 5). How GreatSchools steers you toward whiter, more affluent schools. Chalkbeat. https://www.chalkbeat.org/2019/12/5/21121858/looking-for-a-home-you-ve-seen-greatschools-ratings-here-s-how-they-nudge-families-toward-schools-wi/
Black, S. E. (1999). Do better schools matter? Parental valuation of elementary education. Quarterly Journal of Economics, 114(2), 577–599. https://doi.org/10.1162/003355399556070
Hasan, S., & Kumar, A. (2024). Who captures the value from organizational ratings? Evidence from public schools. Strategy Science, 9(3), 248–266. https://doi.org/10.1287/stsc.2023.0113
Tiebout, C. M. (1956). A pure theory of local expenditures. Journal of Political Economy, 64(5), 416–424. https://doi.org/10.1086/257839
Valant, J. (2017, November 6). Who is evaluating US schools? Brookings Institution. https://www.brookings.edu/blog/brown-center-chalkboard/2017/11/06/who-is-evaluating-us-schools/